Wie man Grafiken und Diagramme in Text umsetzt - Übung 1
Wenn du ein paar Tipps befolgst, ist es ganz einfach Grafiken und Diagramme in Sprache umzusetzen.
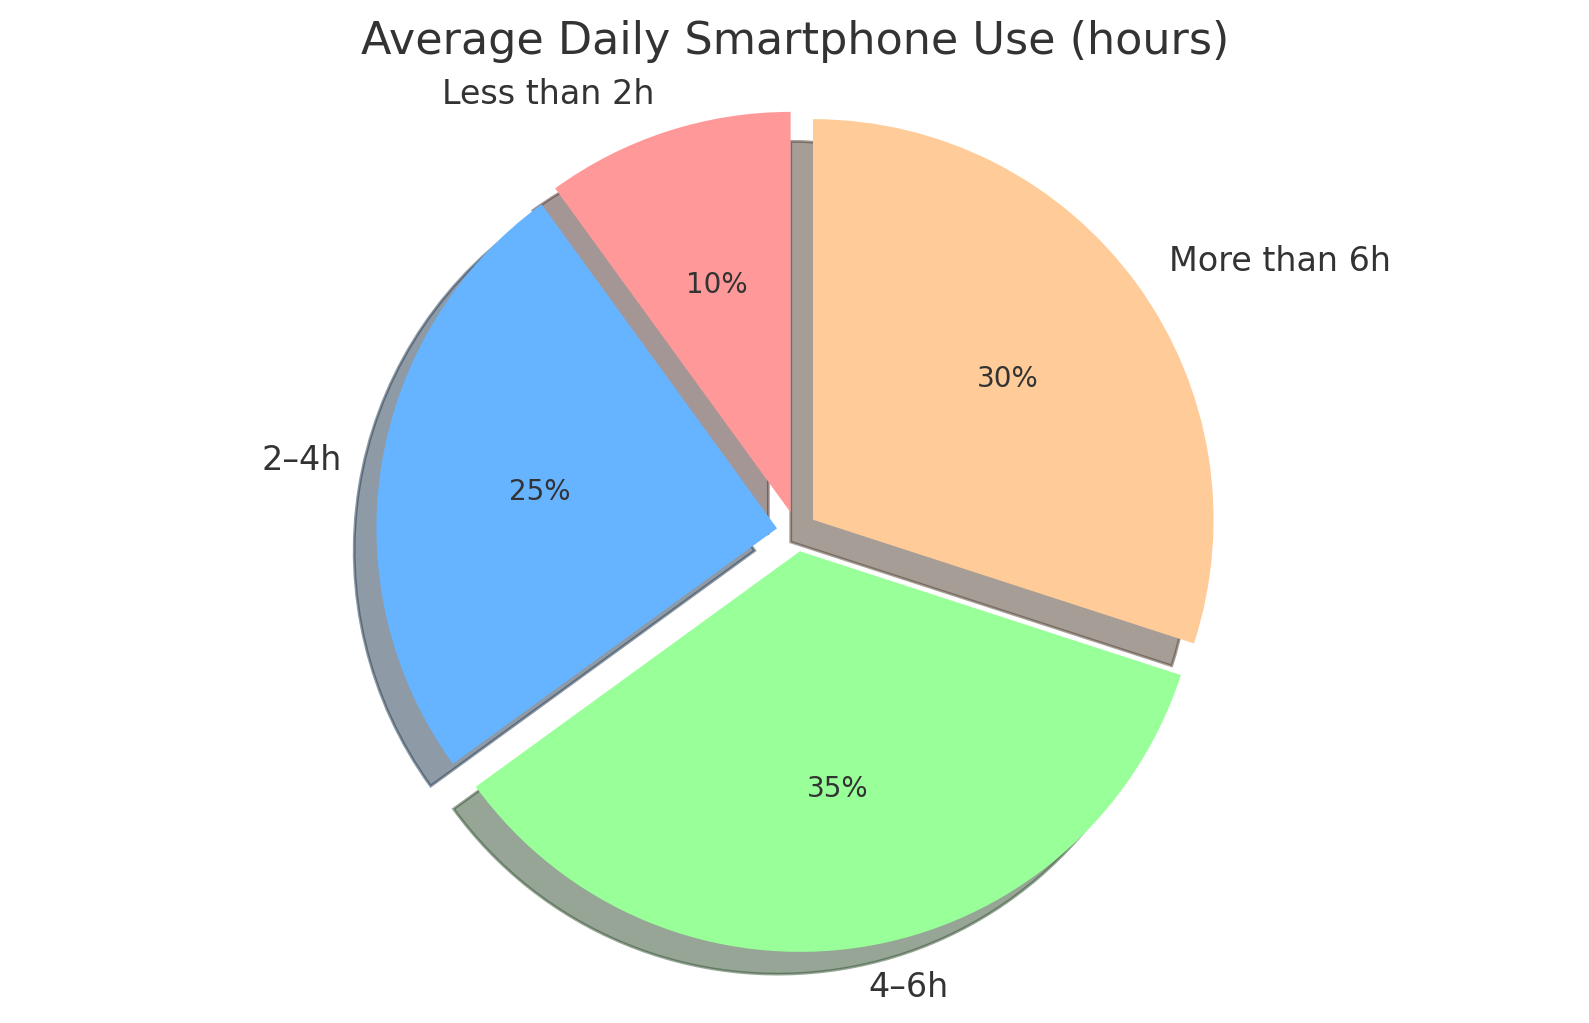
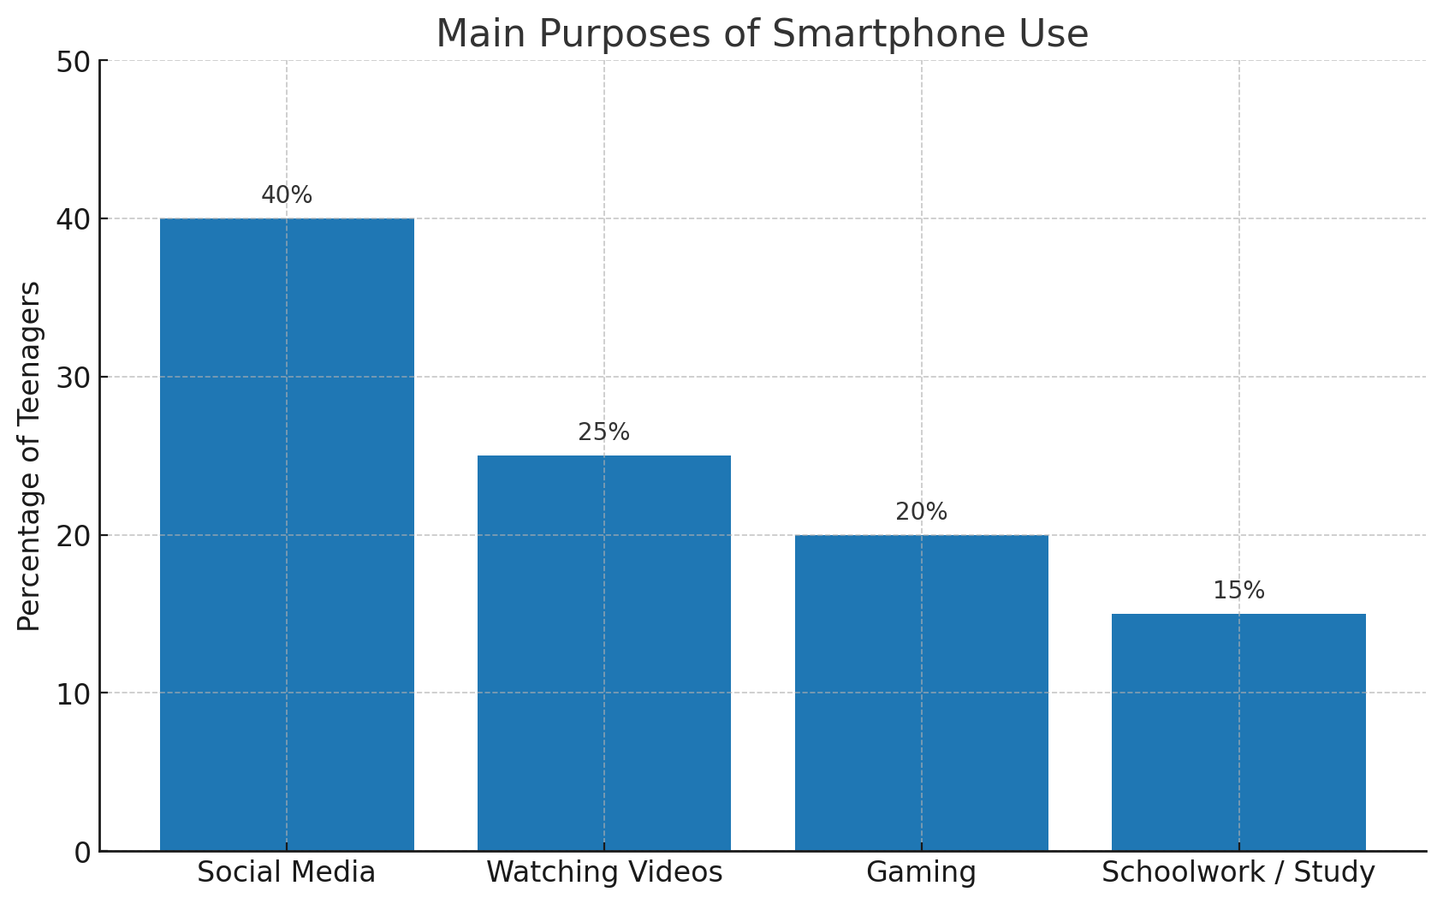
Sieh dir die beiden folgenden Diagramme an, wie Teenager ihr Smartphone benutzen:
https://editor.mnweg.org/montessorischule-kaufering/dokument/articles-including-charts-and-diagrams
Nutze einfache Sätze, um das Thema zu nennen.
Beispiel:
The diagrams show how much time teenagers spend on their smartphones and what they use them for.
Sag zuerst, was auffällt (highest/lowest, most/least).
Dann nenne ein bis zwei konkrete Zahlen.
Beispiele von useful phrases:
The largest group…
Only a small percentage…
Around one third…
Wieder: Zuerst Überblick, dann Beispiele.
Verwende linking words: also, in addition, whereas, while.
Verbinde die Infos: Gibt es Zusammenhänge?
Beispiel:
Many teenagers spend more than four hours a day on their phones, but only a few use them mainly for schoolwork.
Kurze eigene Bewertung (persönliche Meinung).
Useful phrases:
It is surprising that…
In my opinion…
I think it is important to…
Useful language
Quantities: a quarter, one third, more than half, less than 10%
Comparisons: more than, fewer than, twice as many, slightly higher/lower
Contrasts: whereas, while, however, on the other hand
https://editor.mnweg.org/montessorischule-kaufering/dokument/articles-including-charts-and-diagrams
When researching for your article you found the diagrams of page 1 on the internet.
Use all the aspect from the material and write an article of about 100 words.
https://editor.mnweg.org/montessorischule-kaufering/dokument/articles-including-charts-and-diagrams
Wie man Grafiken und Diagramme in Text umsetzt - Übung 2
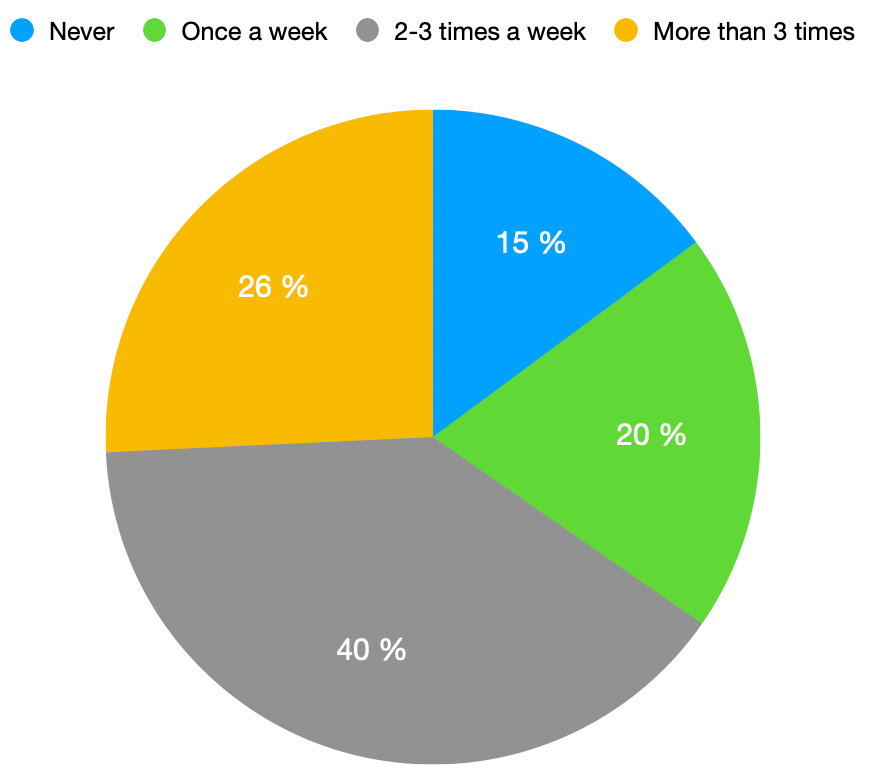
How often teenagers do sports per week.
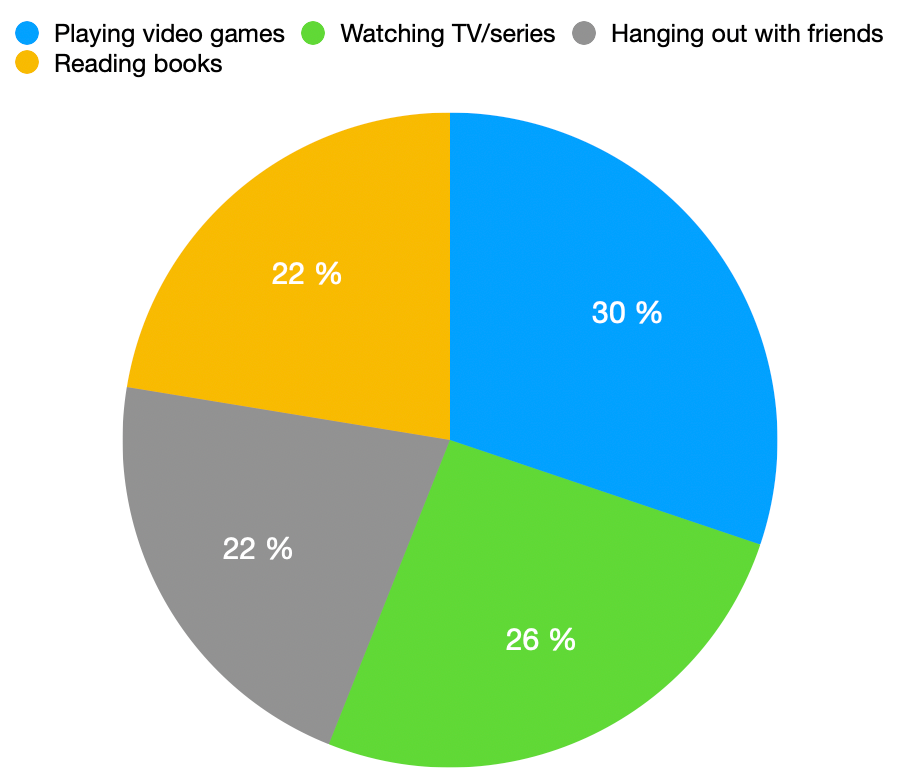
Most common free time activities (not including sports).
https://editor.mnweg.org/montessorischule-kaufering/dokument/articles-including-charts-and-diagrams
Useful language
Overview: The first/second diagram shows…, The largest group is…, Only a small percentage…
Comparison: … while …, … whereas …, … more than …, … less than …
Opinion: In my opinion, …, I think it is important to…, It would be better if…
Expressing surprise: Surprisingly, …, It is interesting that…, I didn’t expect that…
Write a 100-word article for your school's English magazine.
Use all the information of the diagrams.
https://editor.mnweg.org/montessorischule-kaufering/dokument/articles-including-charts-and-diagrams